arfa's musings about a coin spinning on a tabletop

Discussion in 'Free Thoughts' started by arfa brane, Jan 27, 2022.

  1. arfa brane call me arf Valued Senior Member

    Messages:
    7,832
    Right. Good thing people like you come along and don't put on a show, about people putting on a show.

    Actually I think you just don't really know a whole lot, after all. You make a good hall monitor though.
     
  2. Guest Guest Advertisement


    to hide all adverts.
  3. arfa brane call me arf Valued Senior Member

    Messages:
    7,832
    And here we are, you now challenge my understanding of the subject I'm discussing, with myself. Honestly, James, you're a bloody terrible audience.

    I do understand what the diagram is, what the lines mean and why someone would plot the sum of those two vectors. I know what they represent. I know what it's all about.

    But I have to tell you, because it's your sandbox and you'll take away the bucket and spade?

    A big hint here about the "I know" thing. The sum of angular precession and angular velocity of a rotating top gives the nutation angle; this can be constant, so their vector sum sweeps out a cone which is 'flat'. Otherwise, the diagram tells us, there is a superposition of the two which induces nutational oscillations.

    Ok, mr smart guy? One of the lines of constant angle (in A, this angle is the colatitude of \(\omega\)), is red in color, so is the angular momentum in both A and B. So what?

    I'll let you figure it out; watch Mr Einstein over here.
     
    Last edited: Feb 5, 2022
  4. Guest Guest Advertisement


    to hide all adverts.
  5. arfa brane call me arf Valued Senior Member

    Messages:
    7,832
    Note to self: the values \(\{0,\;\pi,\;\pi/2\}\) in the graph mean slightly different things than coordinates.
    Also the family of curves has a subset that does not intersect either axis. The curves that do, colored black, all intersect the \(\omega_p\) axis which is horizontal.
    Its about the black lines, they represent where the angle \( \vartheta\), the nutation angle, is constant; i.e. they are the solutions to equations that satisfy \( \frac {d} {dt} \vartheta = 0 \). The lines of constant colatitude represent the solutions of an equation of motion.

    For this example, the top has four of these, in its vector space.

    Here's that pesky old diagram again, telling us stuff about the dynamics.

    Please Register or Log in to view the hidden image!


    Those other labels in diagram C, represent constant values for the nutation angle. When \( \vartheta\) is zero, there are two blue patches that represent sums of the 'component vectors' where the angle stays zero.
    The first blue line which lies on the boundary of each blue area is the first line of constant colatitude ( \( \vartheta\) ). When \( \vartheta\) is hanging straight down (the region labeled \( \pi\) in the centre of the plot), there is no restoring force, we see that the red line is where \( \vartheta\) and L are parallel.

    The diagram is a plot of directions, not magnitudes; the black lines are where combinations of two vectors leave \( \vartheta\) constant. I think that's about it.
     
    Last edited: Feb 5, 2022
  6. Guest Guest Advertisement


    to hide all adverts.
  7. arfa brane call me arf Valued Senior Member

    Messages:
    7,832
    The article and its diagrams about pendulums, are about undamped (as much as possible) SHM. These kind of 'heavy' tops illustrate what kind of behaviour emerges when you have plenty of angular momentum to play with.

    So, just one more pass over that plot of \(\omega_p + \omega_s\). The independence and or dependence of variables in an equation of motion is important when you want to analyse kinetic motion such as a spinning top.

    So you see that you might consider the plot as either \( f(\omega_p) = \omega_s\); except that precession depends on the top having angular momentum, so maybe it's the other way around: \( f(\omega_s) = \omega_p\).

    Or maybe it's a function \( g(\omega_p + \omega_s) = (|\omega|,\;\vartheta)\). The output of this function g() is a vector; the lines in the plot are where it has a constant angle. The blue regions labelled with a 0, are where the nutation angle (not the top) is vertical.

    . . . so each solid blue or black line represents a locus of points where \( \vartheta\) stays constant; each region between the lines colored white is where the angle varies with precession--there is an interdependence in these regions.

    The lines, as the red ones are, can all be labelled with a constant value, a rational fraction of \( \pi\). Clearly the central region which is labelled \( \pi\) is one that is a kind of empty space, although the top can have plenty of angular momentum--it looks like the boundary is asymptotic, doesn't it?

    Finally, if you're still confused about why it looks symmetric (the red line is your standard hyperbola), angular momentum has two directions, and the plot includes this.

    So you need only consider one half of the vector plot. I see I should correct something I said about the black lines. These are all in the lower half plane of the lab frame; the blue lines in the plot are the corresponding colatitudes above the horizontal. So the lower ones won't be available 'eigenstates' if the top can't rotate that far--there's a lab bench in the way, say.

    Experimental fact: if you want to see behaviours predicted by graphs, you need an experiment with the right number of degrees of freedom.
     
    Last edited: Feb 6, 2022
  8. arfa brane call me arf Valued Senior Member

    Messages:
    7,832
    Now I'm getting the goods on those three diagrams, I can say this:

    The graph C is artificial because \(\omega_s\) is not perpendicular to \(\omega_p\), in the lab frames. It takes the magnitudes of each vector to the plane, but each axis has the same units so it's the real plane. The magnitude of the nutation is not in C either, but the angle is.

    So there are three parameters in C. I can write all this as: \( |\vartheta\rangle = |\omega_p||0\rangle + |\omega_s||1\rangle\); the graph's function. Which is to say the "three parameter graph" is a graph of the Hilbert space the precessional and nutational motions are in.

    Hokay so the regions in the graph are all bounded by lines of constant \( \vartheta\), a family of latitude lines where the top precesses smoothly. But you should specify some initial conditions: the top is more likely to hang upside down than stay upright with no gyroscopic motion.

    The graph is saying if this is the initial condition then \( \vartheta\) stays pointing in that direction, and increasing the angular momentum won't lift it up; this approaches an asymptotic limit. But if the top is spun up while it's upright, it will stay upright with \( \vartheta\) also vertical; the top is allowed to precess or nutate but this isn't shown in the graph either, just regions where it can and lines where an angle is held constant.

    Sounds like calculus on a stick.
     
    Last edited: Feb 6, 2022
  9. arfa brane call me arf Valued Senior Member

    Messages:
    7,832
    What about the black lines, in C, that intersect the \(\omega_p\) axis? I can't see that these represent anything physical because \(\omega_s\) is zero along that axis. So maybe the intersections are just analytical--the plot is a phase diagram after all. It does seem to say there are real physical lines of constant 'colatitude'.

    Also the way I've notated the vector equation says nothing about the dynamics; it needs to have some real stuff plugged in like moments of inertia. If your top isn't 'regular' it can be tedious to calculate. It's even harder if the top isn't completely rigid but filled with fluid, say. Tops exhibit complex motions, and physicists are still looking at their dynamics.

    Why? Because physicists are really a bunch of big kids, who need to grow up.
     
  10. James R Just this guy, you know? Staff Member

    Messages:
    39,421
    I actually think you're probably not qualified to judge how much I know. But it doesn't matter. You do you.
    I'll leave you to talk to yourself. You seem to be your own favorite audience. I'm out.
     
  11. arfa brane call me arf Valued Senior Member

    Messages:
    7,832
    Ok. Bye.
     
  12. arfa brane call me arf Valued Senior Member

    Messages:
    7,832
    Rigid body dynamics means you analyse moments of inertia.

    This analysis involves calculus--you integrate over a lot of small-grained volumes, you assume things like an homogenous solid, no density fluctuations outside an average. So essentially you take a solid object and give it some coordinates; often it's easiest to have an origin coinciding with the COM, often it's the case that this is in the geometric centre, so it will also be a centre of rotation.

    You choose which axis of your top will be the one that gets all the initial turning force, or applied torque. Your map of the 'rigid' moment of inertia, means that every small mass volume has at least a pair of coordinates; if you use a top that is like a disk, say a china dinner plate, you can get a good approximation by assuming it is a flat disk, or you could do a fairly rigorous but tedious calculation (or get some software to do the work).

    So, the fact that you give chunks of matter a set of coordinates, their integral is then a 'scalar' object, mathematically, with a pair of indices. You now actually have a matrix representation in three dimensions for this moment of inertia, and you get a thing called the gyroscopic radius when you again use the total mass and this inertia tensor, in a simple relational formula, like Ohm's law for rigid bodies.
     
  13. arfa brane call me arf Valued Senior Member

    Messages:
    7,832
    Something goes here about the geometric distribution of mass, symmetrically or otherwise, about a 'centre' of rotation.

    Objects in three dimensions rotate around lines that pass through a centre; the most general kind of gyroscopic motion is that of a sphere because of the symmetric distribution of mass. Ideally the solid sphere (mathematically a 3-ball) should be made of something that has the same density at all points (correction at all small volumes that can be addressed from the centre, about which they can rotate--but they just have to 'be'there).

    Even better gyroscopic effects are seen in a disk (with of course, a total mass M, a sum over 'a lot of smaller parts'). So you look up the radius of gyration for a disk, and it has two quite simple integrals--there are two ways a disk can 'gyrate' about its COM.

    What I guess I want, is a way to determine what flips a coin from one to the other, what are the conditions; I can at least assume a semi-regular path for a coin because of the 'regular' motion, and you want some input from friction to slow the coin's upright mode and eventually flip it to "ringdown".

    The question I want to answer is, when does it happen. The why is because when it flips over to one face or the other, a measurement is available. Like an eigenvalue, perhaps. No, actually.

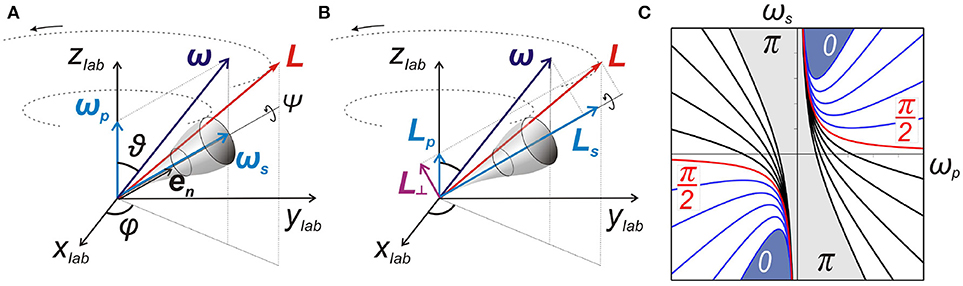
    And I might have patched up the difficulty with the real values on the horizontal axis, in the C graph; here the value for the spin angular momentum is zero. But that happens in a torsion pendulum, it rotates in one direction, then the opposite direction, it changes along the horizontal line.
    So that's all I need in the model, as it were. Even if the way I construct a top with gyroscopic angular momentum won't see a mode like that, in principle there is one.

    If you've run out of popcorn, the next video is coming up. Lifting a 20kg weight at the end of a rod the length of your arm, with one arm sounds hard, if not shoulder-dislocating. If it's spinning though, it's a lot easier, but it aren't anti-gravity. It's a restoring force due to an applied torque.

    After the easy part, you have to pay back mother nature and be careful about how you now lower it back down; there's a bit of a kick.
     
  14. arfa brane call me arf Valued Senior Member

    Messages:
    7,832
    Ha. I might have found a place inside to laugh.
    Separate the wheat from the chaff.

    Much of this figuring out what depends on what; for instance what conditions mean that you invariably see a coin ring down, after it tips or tilts over?
    And you need to decide what things you can fix, one is the amount of mass in your gyroscope, maybe another is how much of the mass contributes to this gryation radius. Another fixed element is the geometry, the location of all the little particles (if you could count them all).

    One thing you can't fix is time, the only fixable there is deciding when to apply an external torque. Or when, if you've decided to, to get that car into a repair shop, or when to, do anything I guess. There is no fixing time because we cant give time more time, or less time; we have to multiply an interval of time by 1. Every time.
     
  15. arfa brane call me arf Valued Senior Member

    Messages:
    7,832
    I also need to note (carefully) that the two diagrams A and B, are the situation where the end of the top is fixed.

    Since it is a top, the only other possibility is when it isn't fixed and the end roams around because of friction (but that isn't the only reason). One of the other reasons, is the shift in the centre of mass, and the point where all the inertia is. All the vectors in A and B (alternative vector spaces over the same plane section), get rearranged and have a different origin.

    That little bloke is one busy little bugger. Good on ya, mate.
     
    Last edited: Feb 9, 2022
  16. arfa brane call me arf Valued Senior Member

    Messages:
    7,832
    Ha. If you pick up the top and throw it, suddenly everything is relative to a centre of mass.
    Although the top might spin, tumble, wobble around etc, there is no reactive surface pushing on the business end (the atmosphere will only tug feebly and only contribute negligible drag)--like disconnecting a component from a circuit of sorts.

    Plugging it back in means re-connecting the tip to a reactive surface; one that will push with a constant force -kx, wont bend or buckle too much; but it has to--it's an elastic surface!

    Geddit?

    Even if you assume (naively) the top is fixed to a rigid surface, the top itself is reactive! Easily confirmed if it's made of metal--it will ring like metal does when struck with an appropriate striker. As it rotates on its tip, vibrations in the material of the top will generate reactive forces.

    Unless there is zero friction.
     
  17. arfa brane call me arf Valued Senior Member

    Messages:
    7,832
    That phase space diagram, is a relation between two rotations, one is the driver, or the engine for the other since, with no angular velocity there is no precession.

    So the phase space diagram says there are points along the horizontal where the angular velocity of the top is zero, but the top is precessing.
    Those points correspond to the minima of \(\omega_s\) as a function of \(\omega_p\). This is not the physical case because of the dependence; it's an analytic function. The slice through the experimental frame is analytic. Forces are analytic, because they don't "really" exist, but they solve physics problems.

    The blue curves all have minima where the curve is concave upward, so each minimum has an 'address' in the basis, and the points of intersection along the \(\omega_p\) axis are analytic. They are where the function \( g (\omega_s) = 0\). The minimal values on the blue curves are the minimum value for \(\omega_s\) so the top stays stable and is precessing (without nutation).

    I think it's a good example of how to do physics. Just sayin'
     
    Last edited: Feb 12, 2022

Share This Page