Decrease in Solar Activity Predicted: is Global Cooling imminent?

madanthonywayne

Morning in America
Registered Senior Member
A variety of measurements recently all suggest the same thing: after 2013 we will see a drop in solar activity , perhaps a large one.

Such drops are generally associated with a period of global cooling. The most famous such case being the Maunder Minimum, a 70-year period with virtually no sunspots from 1645 to 1715. Average temperatures in Europe sank so low during that period that it came to be known as "the Little Ice Age."

Is another little ice age coming? Or will global warming and decreased solar activity cancel each other out? (Could we be so lucky? It would be like a reprieve from God). Or will there be no noticeable effect as some climate scientists are predicting?

http://cosmiclog.msnbc.msn.com/_news/2011/06/14/6857473-solar-forecast-hints-at-a-big-chill

PS. Meanwhile, some people are also worried that the solar maximum we are headed for in 2013 may well cause major problems itself in the form of solar flares knocking out sensitive electronic equipment and possibly the entire power grid.
http://cosmiclog.msnbc.msn.com/_news/2010/06/24/4558109-solar-cycle-sparks-doomsday-buzz
 
Last edited:
-A variety of measurements recently all suggest the same thing: after 2013 we will see a drop in solar activity , perhaps a large one...

-Is another little ice age coming? Or will global warming...

-PS. Meanwhile, some people are also worried that the solar maximum we are headed for in 2013... may well cause major problems itself in the form of solar flares knocking out sensitive electronic equipment and possibly the entire power grid..

Wrong, wrong and wrong again.

Proponents of the global warming scam (taxing carbon-dioxide etc...) have managed to reverse the actual sunspot and solar flare cycle in many recent mainstream news articles. They have capitalized on one isolated solar flare and created this hype and fervor to support "global warming".
That in itself is an amazing feat to me. The fact that no one is reporting such an obvious error should be a wake-up call to anyone who knows better.

We are not heading for a maximum in 2013. It is the minimum. Just the opposite.
The 22 year sun-spot and solar flare cycle last peaked in 2002 and will not peak again in 2024.
2013 is the midpoint between the peaks when the Sun's normal output is at it's lowest.

If you can remember far enough back this same concern of possible electronic disruption was in the news leading up to the summer of 1980.
That was an actual peak year in the 22 year cycle, and the hottest year on record with over 30 days of triple digit heat in the great plains of North America.

Now, do the math... 1980, 2002, 2024.
2013 is the midpoint between the peaks. The coolest point in the cycle, not the hottest.
 
Last edited:
Wrong, wrong and wrong again.

Proponents of the global warming scam (taxing carbon-dioxide etc...) have managed to reverse the actual sunspot and solar flare cycle in many recent mainstream news articles. They have capitalized on one isolated solar flare and created this hype and fervor to support "global warming".
That in itself is an amazing feat to me. The fact that no one is reporting such an obvious error should be a wake-up call to anyone who knows better.

We are not heading for a maximum in 2013. It is the minimum. Just the opposite.
The 22 year sun-spot and solar flare cycle last peaked in 2002 and will not peak again in 2024.
2013 is the midpoint between the peaks when the Sun's normal output is at it's lowest.

If you can remember far enough back this same concern of possible electronic disruption was in the news leading up to the summer of 1980.
That was an actual peak year in the 22 year cycle, and the hottest year on record with over 30 days of triple digit heat in the great plains of North America.

Now, do the math... 1980, 2002, 2024.
2013 is the midpoint between the peaks. The coolest point in the cycle, not the hottest.
Wrong, wrong, and wrong again.

It's an 11 year cycle.
The solar magnetic field reverses itself on an 11 year cycle, meaning the polarity repeats every 22 years.

This is pretty basic science.

Synoptic-solmag.jpg

No doubt, you'll now try and convince us that this graph is a have or a con, even though the 11 year cyclle was discovered back in 1843.
 
I'll bet they discovered a lot of things back in good ol' 1843 we have since either totally discarded or upgraded by today's standards.
You have either misinterpreted the graph or someone has misinterpreted it to you.

11 years up and 11 years down. That makes a 22 year cycle. It's basic Meteorology 101. Weather patterns have followed this cycle since modern records have been kept.
Let's go backwards from 1980. 1958, 1936...'58 was a record scorcher and '36 was the middle of the famous "dust bowl" years.

Looking at what you have provided, at EQ it may appear to be an 11 year cycle, but the colors only repeat at 90S and 90N on a 22 year cycle.
I'd say your graph alone then is not conclusive.
 
Last edited:
I'll bet they discovered a lot of things back in good ol' 1843 we have since either totally discarded or upgraded by today's standards.
Yeah, not this, and a lot of modern science has its roots back that far and further.

You have misinterpreted the graph. 11 years up and 11 years down. That makes a 22 year cycle.
No I haven't.
The + and - sign reflects the polarity, and the number reflects the absolute strength.
From 1987 to 1996 is one full cycle (9 years).
From 1998 to 2007 is another full cycle.
Accross these two cycles, the polarity of the suns over all magnetic field reverses, and then reverts back to its original polarity.
 
Addendum: Here is the Butterfly diagram, which represents the number of sunspots recorded, their area, their latitude, and when they were recorded.
Sunspot-bfly.gif

Please note, the 11 year, not 22 year cycle.
 
Looking at what you have provided, at EQ it may appear to be an 11 year cycle, but the colors only repeat at 90S and 90N on a 22 year cycle.
I'd say your graph alone then is not conclusive.
The magnetism graph is completely conclusive if you understand what it means, which you clearly don't.

But fine, if you don't like that then please, explain why sunspot numbers - (one of) the mechanism(s) by which solar activity is thought to directly influence Earth's climate, follows an 11 year cycle, not a 22 year one like you have WRONGLY asserted multiple times now.
 
Your 2nd graph looks pretty good, but if you had read on down in the Wiki article you would have seen this;

"Hale's observations revealed that the solar cycle is a magnetic cycle with an average duration of 22 years. However, because very nearly all manifestations of the solar cycle are insensitive to magnetic polarity, it remains common usage to speak of the "11-year solar cycle".
And if you had read what I said right from the start, you would realize that's exactly what I have been saying the whole time.

The polarity of the suns magnetic field reverses every eleven years.
The 22 year cycle is the period of time it takes to reverse, and then revert back to its original polarity.
Solar activity follows the 11 year cycle, rather than the 22 year one.
 
The magnetism graph is completely conclusive if you understand what it means, which you clearly don't.

But fine, if you don't like that then please, explain why sunspot numbers - (one of) the mechanism(s) by which solar activity is thought to directly influence Earth's climate, follows an 11 year cycle, not a 22 year one like you have WRONGLY asserted multiple times now.


I first heard of the 22 year cycle back about 1978 when CB radios were popular and a disruption in their operation was predicted in the 1980 peak.
I was an amateur storm chaser for many years and after a string of f-5 tornadoes nearly wiped some nearby towns off the map, I began to notice a pattern in severe weather outbreaks that seemed to correlate with a 22 year cycle.
 
Last edited:
I first heard of the 22 year cycle back about 1978 when CB radios were popular and a disruption in their operation was predicted in the 1980 peak.
I was an amateur storm chaser for many years and after a string of f-5 tornadoes nearly wiped some nearby towns off the map, I began to notice a pattern in severe weather outbreaks that seemed to correlate with a 22 year cycle.

Yes.

There are several recognized multidecadal atmospheric and weather cycles.

None of which changes the observed fact that Solar Activity follows a well established eleven year cycle related to the rise and fall of the strength of the terestrial magnetic field in response to the twenty two year solar magnetic cycle during which the solar magnetic field decays, reverses, decays again, and reverts.
 
It won't affect the warming trend, the sun's variability is dwarfed by the greenhouse effect.
The solar variability we've seen over the last hundred years or so has been minimal. But if the decrease in activity is on the order of the Maunder Minimum, no one can say for sure what effect it would have. History, however, would suggest a quite large effect.
 
If you don't already know this, I can't help you.

What are you talking about, do you actually claim that you can predict the precise balance between the suns UNKNOWN DECREASE in output and the complex phenomena know collectively as global warming? You must be a genius of the highest caliber :rolleyes:
 
I don't think there is any precise balance. A decrease in solar output would only slow the warming slightly. It's been a long time since solar output was the most significant factor.
 
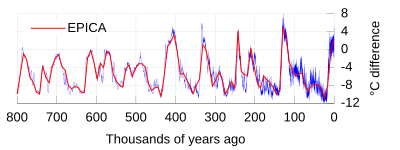
The long term ice core record: the last 800,000 years:

400px-EPICA_temperature_plot.svg.png


Yhis confirms that both very hot and very cold climates have happened throught time here on Earth so that while many suggest that greenhouse effects are causing this warming trend in reality it can also be attributed to the weather that happens naturally as well.
 
Back
Top