
You are using an out of date browser. It may not display this or other websites correctly.
You should upgrade or use an alternative browser.
You should upgrade or use an alternative browser.
Global warming
- Thread starter timojin
- Start date
Use solar, use more efficient vehicles, take mass transit, paint your roof white (in some places) recycle, bike to work, eat vegetarian, compost, shop/buy/eat locally - for starters.How can I help to reduce global warming.
Use solar, use more efficient vehicles, take mass transit, paint your roof white (in some places) recycle, bike to work, eat vegetarian, compost, shop/buy/eat locally - for starters.
I wonder how many of us would do that ?
I have pannels
How can I help to reduce global warming
We got shocked when Trump withdrew from Paris agreement .
I believe global warming is a function of consumption , so can we reduce some of useless consumption and be part of protecting our environment.
My point of this post what are the BIG MOUTHS doing for the environment , Can thy sacrifice some of their wasteful life to reduce the global warming and stop complaining about Trump, let the dership do their thing and we should be responsible for doing our thing for the environment .
How can I help to reduce global warming
We got shocked when Trump withdrew from Paris agreement .
I believe global warming is a function of consumption , so can we reduce some of useless consumption and be part of protecting our environment.
You are correct, Timojin . . . . consumption is the key! . . . . we breathe (consume) too much oxygen . . . . .which is exchanged for CO2 . . . . Ridding the earth of humans and other O2 breathers would help! How can you help? . . . . .in lieu of stopping breathing altogether . . . . breathe more slowly and shallowly . . . . . . do not yell loudly at your spouse . . . . grow lots of plants (no NOT that kind!) . . . . . just a few suggestions (HAHA!) [AND, Don't worry too much . . . . . as was said to Chicken Little . . . . afterall . . . ."The sky is NOT falling"]
Also, regarding another environmental matter . . . . .Don't eat to much . . . . as the old folk singer Woody Gutherie once said regarding important things he had learned about life: "The more you eat, the more you sh_t" . . . . so to save our air and clean water . . . . don't fart and don't eat too much . . . that will solve many human environmental issues.
Last edited:
They should (and many do) both.My point of this post what are the BIG MOUTHS doing for the environment , Can thy sacrifice some of their wasteful life to reduce the global warming and stop complaining about Trump
That would be great if it worked out. But often it doesn't. For example, you would not now have the option for "pannels" if the government had not pumped a lot of money into research, development and buildout of solar electric systems.let the dership do their thing and we should be responsible for doing our thing for the environment .
A human puts about 800 pounds of CO2 in the air a year. An SUV puts about 14,000 pounds of carbon in the atmosphere a year. So you could "rid the Earth" of a few SUV's and remove more CO2 than offing 50 people. (And probably get in less legal trouble in the process.)You are correct, Timojin . . . . consumption is the key! . . . . we breathe (consume) too much oxygen . . . . .which is exchanged for CO2 . . . . Ridding the earth of humans and other O2 breathers would help!


danshawen
Valued Senior Member
The gas mileage on my AWD 2016 Subaru Forrester is about 30 mpg because of the new continuously variable transmission. Only had it a short time, but it is hands down the most efficient mode of transportation I have ever owned. Its Eyesight collision avoidance system is pretty good too, but if you don't like it, you can also turn it off.
It is rare that all of the best engineering get applied in just the right amounts to a single vehicle design, but this one comes closest of all the vehicles I have ever owned or driven.
It is what is called a "Partial Zero Emissions Vehicle", which means that it already exceeds the strictest emissions standards in the State of California, which are the tightest emissions standards in the country.
Expensive perhaps, but it has made driving your own vehicle a lot less polluting.
Is that a battery powered moped in your statistics?
exchemist
Valued Senior Member
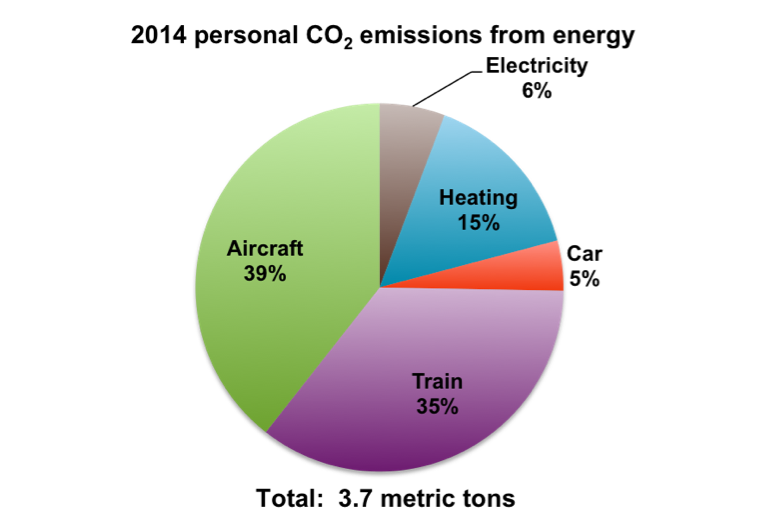
There seems to be something contradictory about these charts. One shows a higher emission by train than by car if 4 people share, while the other shows the train emission to be 1/3 of the car (again 4 people sharing).
Also the top chart shows more emission by train than by car use, which is odd, and air travel is the highest, which seems most unlikely. For what sample, of what population, is this true?
I suspect we need to know something about the background to these charts before any conclusions can be drawn. Can you provide any?
Cut way down on disposable cups, dishes, forks & spoons. Walk more. Sleep at night. Use less toilet paper. Don't buy new furniture just because you are bored.
<>
<>
exchemist
Valued Senior Member
Buy a bicycle with a pannier on it, so you can use it to go to work and do the shopping. Use public transport. Only run the AC when it is really hot, and adjust it so you still sweat a little bit when it is on.Cut way down on disposable cups, dishes, forks & spoons. Walk more. Sleep at night. Use less toilet paper. Don't buy new furniture just because you are bored.
<>
Don't want to seem like I'm criticizing that car (everybody says they're great winter cars, too), but:The gas mileage on my AWD 2016 Subaru Forrester is about 30 mpg because of the new continuously variable transmission.
Of all the advances made in technology etc over the years, the miserly gains in gas mileage impress me the least. I was getting around 18-20 mpg combination with a 1969 Buick 4 door Lesabre, 350 V8, three speed automatic, 120k on the 4 barrel carburetor and engine no rebuild, make and break ignition and bias belt tires and cheap oil, and all the fine tuneups and maintenance one would expect from a 20 year old kid with a job on a demolition crew. You set up that same basic car with a blueprinted engine, solid state ignition and injectors, synthetic oil, a five speed manual, and modern radial tires, and if you couldn't get 25 out of it I'd eat it.
Thirty + years of technological advance later, my wife gets 38+ combination (mostly highway) with a 2002 Toyota Corolla, 2.2 4 cylinder, five speed manual, solid state ignition, high quality radial tires, and good maintenance.
Fifteen years after that people are happy with 30 mpg. The manufacturers advertise it.
Of all the areas where personal savings and AGW response dovetail nicely, the standard 40 mpg car seems like a no-brainer.
My dropped post, above, claimed the bs level of such charts was high enough and obvious enough to allow labeling them a deliberate lie.I suspect we need to know something about the background to these charts before any conclusions can be drawn
What we need to know is that the purpose of these charts is to forestall things like regulating corporations and taxing rich people in response to AGW, and turn the discussion of AGW into a referendum on the hypocrisy of anyone who says bad things about coal fired electricity while flying around in airplanes.
Look, just for starters: heating, cooling, and trains all use a lot of electricity. What's even in those charts?
Last edited:
exchemist
Valued Senior Member
My dropped post, above, claimed the bs level of such charts was high enough and obvious enough to allow labeling them a deliberate lie.
What we need to know is that the purpose of these charts is to forestall things like regulating corporations and taxing rich people in response to AGW, and turn the discussion of AGW into a referendum on the hypocrisy of anyone who says bad things about coal fired electricity while flying around in airplanes.
Well funnily enough that explanation had crossed my mind, but I did not want to make an accusation without grounds for doing so. I did wonder if this collection of charts might have been deliberately put together from different contexts, for the purpose of making it look as if the science was all over the place. I'd be happy to discover my suspicions are unfounded.
danshawen
Valued Senior Member
I'm not saying that more passenger miles (public transportation, walking, bicycles) aren't a more efficient way to go, and it does seem a paltry amount of mileage increase for most commutes, but it's hard to beat a healthy pair of legs or a vehicle you can direct to go wherever you wish to go, whenever you wish to go there, in terms of convenience. Convenience is really the only thing that sells in transportation, or anything else.Don't want to seem like I'm criticizing that car (everybody says they're great winter cars, too), but:
Of all the advances made in technology etc over the years, the miserly gains in gas mileage impress me the least. I was getting around 18-20 mpg combination with a 1969 Buick 4 door Lesabre, 350 V8, three speed automatic, 120k on the 4 barrel carburetor and engine no rebuild, make and break ignition and bias belt tires and cheap oil, and all the fine tuneups and maintenance one would expect from a 20 year old kid with a job on a demolition crew. You set up that same basic car with a blueprinted engine, solid state ignition and injectors, synthetic oil, a five speed manual, and modern radial tires, and if you couldn't get 25 out of it I'd eat it.
Thirty + years of technological advance later, my wife gets 38+ combination (mostly highway) with a 2002 Toyota Corolla, 2.2 4 cylinder, five speed manual, solid state ignition, high quality radial tires, and good maintenance.
Fifteen years after that people are happy with 30 mpg. The manufacturers advertise it.
Of all the areas where personal savings and AGW response dovetail nicely, the standard 40 mpg car seems like a no-brainer.
My dropped post, above, claimed the bs level of such charts was high enough and obvious enough to allow labeling them a deliberate lie.
What we need to know is that the purpose of these charts is to forestall things like regulating corporations and taxing rich people in response to AGW, and turn the discussion of AGW into a referendum on the hypocrisy of anyone who says bad things about coal fired electricity while flying around in airplanes.
Look, just for starters: heating, cooling, and trains all use a lot of electricity. What's even in those charts?
Cars like the Prius only show that battery technology isn't yet on board with the efficiency of other components of transportation systems. Even if it gets superior mileage, those batteries are costly to manufacture, maintain and operate.
sculptor
Valued Senior Member
I doubt it.Is that a battery powered moped in your statistics?
sculptor
Valued Senior Member
There seems to be something contradictory about these charts. One shows a higher emission by train than by car if 4 people share, while the other shows the train emission to be 1/3 of the car (again 4 people sharing).
Also the top chart shows more emission by train than by car use, which is odd, and air travel is the highest, which seems most unlikely. For what sample, of what population, is this true?
I suspect we need to know something about the background to these charts before any conclusions can be drawn. Can you provide any?
click on image, then "search google for this image"
Different charts from different sources and countries show different "results"
The main point was that while overall ghg emissions have been falling for eu and usa, air travel emissions and contribution to agw have almost doubled in the last 20 years.............and, then we have the rather unknown feedback from contrails effect on cirrus clouds, and then that effect on global warming.
bottom line: if you ain't gotta travel by air, don't do so.
If you ain't gotta travel, don't do so.
don't use an air conditioner
and
plant and nurture some trees.
(with my planted trees, I went carbon neutral over 20 years ago-----------then to a negative carbon footprint).